I often find myself saying, “Yes, you can do that in PHP.” When I was challenged with writing a code profiler in PHP, I thought I would choke on those words. However, I discovered that it’s both possible and incredibly useful to write your own code profiler in PHP. So, I’d like to share my findings about how to write a code profiler, what pitfalls you will encounter, and offer you some working code to get you started. You may have used a code profiler such as xdebug or xhprof before. These profilers require you to load a PHP extension.
Profiling Without Extensions
If you were not able to load any new extensions into your environment, you would not be able to use classic profiling tools like xdebug. What’s the best way to solve that problem?
Scriptable Profiling
Consider the use case of a custom profiler. For example, in WordPress, plugins are confined to a known set of files.
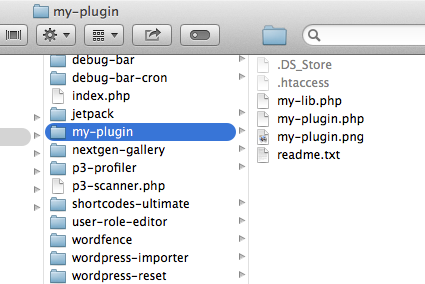
The “my-plugin” plugin is entirely contained within the wp-content/plugins/my-plugin folder.
We found it incredibly useful to have a profiler that knew the difference between a WordPress plugin, a WordPress theme, and the WordPress core based on what was happening in the code or where the function was defined.
Or, perhaps you’d like your profiler to automatically capture the function arguments every timeDbAdapter::query() is called and log them to a file. You can do this with a custom profiler.
Writing the Profiler
PHP has an internal function called register_tick_function() that lets you call a function whenever a tickable event occurs. A tickable event is a low level parser operation. Generally, this is one tick per statement, but there are exceptions. You can read more on the PHP documentation site
declare(ticks=1);
register_tick_function('do_profile');

func_one();

function do_profile() {
	$bt = debug_backtrace();
	if (count($bt) <=1) {
		return;
	}
	$frame = $bt[1];
	unset($bt);
	$function = $frame['function'];
	echo __FUNCTION__ . ' :: ' . $function . PHP_EOL;
}

function func_one() {
	echo __FUNCTION__ . PHP_EOL;
	func_two();
}

function func_two() {
	echo __FUNCTION__ . PHP_EOL;
	func_three();
}

function func_three() {
	echo __FUNCTION__ . PHP_EOL;
}
Note: declare(ticks=1); is mandatory. This code tells PHP to call the tick function for a tickable event.
Here’s the output for the above code:
func_one
do_profile :: func_one
func_two
do_profile :: func_two
func_three
do_profile :: func_three
do_profile :: func_two
do_profile :: func_one
You can see in the output that the tick function is called when the function is pushed onto the call stack, and again when the function is popped off of the call stack. Notice that echo is not captured.
Timing Code
Here’s a very simple example of a working profiler. It’s the same code as above, with one important enhancement: do_profile keeps track of the functions and how much runtime was spent in each function. This information is stored in the global $profile array.
Instead of each function printing its name, the functions pause (or sleep) for a specified amount of time. To get a quick overview of the accuracy of the profiler, let’s compare the profiler results with the amount of time we programmed the functions to sleep.
declare(ticks=1);
register_tick_function('do_profile');

$profile = array();
$last_time = microtime(true);

func_one();
show_profile();

function do_profile() {
    global $profile, $last_time;
    $bt = debug_backtrace();
    if (count($bt) <= 1) {
        return ;
    }
    $frame = $bt[1];
    unset($bt);
    $function = $frame['function'];
    if (!isset($profile[$function])) {
        $profile[$function] = 0;
    }
    $profile[$function] += (microtime(true) - $last_time);
    $last_time = microtime(true);
}

function show_profile() {
    global $profile;
    print_r($profile);
}

function func_one() {
    usleep(50 * 1000);
    func_two();
}

function func_two() {
    usleep(500 * 1000);
    func_three();
}

function func_three() {
    usleep(5000 * 1000);
}
After running the above code, here’s the output:
Array (
    [func_one] => 0.050179958343506
    [func_two] => 0.50016498565674
    [func_three] => 5.0001859664917
)
These results match the programmed pauses that were placed in the code.
At this point, I hope your mind is swarming with possibilities. You may have some questions like, “How well does this scale to large projects?” or “Does it really work across platforms?” or “How reliable are these numbers?” or “What’s the performance penalty?”
Check out the P3 Plugin for WordPress. Go Daddy released a performance tool for WordPress (shown below), using this exact technology and it has been used successfully by thousands of customers across dozens of server configurations. This method isn’t perfect (I’ll discuss some known issues later), but it’s perfectly usable.
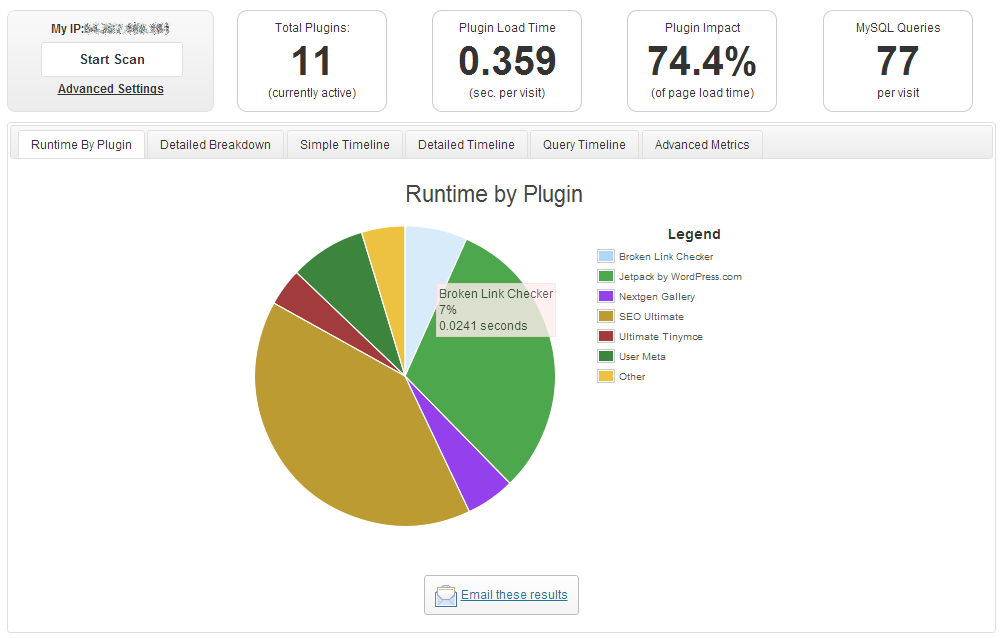
P3 Profiler Results
A Workable Solution
Things get complex from here on out. There are many types of callable functions in PHP that are detected using debug_backtrace(), such as includes, object calls, static method calls, function calls, and anonymous functions. There are also slight variations in the arguments for debug_backtrace() between PHP versions.
The SimpleProfiler class below should get you started on your own custom PHP profiling solution. It’s very similar to what we’re using in P3.
SimpleProfiler.class.php
/**
 * A very simple php code profiler. No extensions required.
 *
 * Example usage:
 * <code>
 * declare(ticks=1);
 * require_once('./SimpleProfiler.class.php');
 * SimpleProfiler::start_profile();
 * // your code here
 * SimpleProfiler::stop_profile();
 * print_r(SimpleProfiler::get_profile());
 * </code>
 *
 * Consider combining with auto_prepend_file and auto_append_file
 *
 * @package SimpleProfiler
 * @author Kurt Payne
 * @copyright 2012 Go Daddy
 * @license http://www.gnu.org/licenses/gpl-3.0.txt GPLv3
 * @version Release: 1.0
 * @link http://inside.godaddy.com/write-code-profiler-php
 */
class SimpleProfiler {

    /**
     * Profile information
     * [file] => (
     *     [function] => runtime in microseconds
     * )
     * @access protected
     * @var array
     */
    protected static $_profile = array();

    /**
     * Remember the last time a tickable event was encountered
     * @access protected
     * @var float
     */
    protected static $_last_time = 0;

    /**
     * Return profile information
     * [file] => (
     *     [function] => runtime in microseconds
     * )
     * @access public
     * @return array
     */
    public static function get_profile() {
        return self::$_profile;
    }

    /**
     * Attempt to disable any detetected opcode caches / optimizers
     * @access public
     * @return void
     */
    public static function disable_opcode_cache() {
        if ( extension_loaded( 'xcache' ) ) {
            @ini_set( 'xcache.optimizer', false ); // Will be implemented in 2.0, here for future proofing
            // XCache seems to do some optimizing, anyway.
            // The recorded number of ticks is smaller with xcache.cacher enabled than without.
        } elseif ( extension_loaded( 'apc' ) ) {
            @ini_set( 'apc.optimization', 0 ); // Removed in APC 3.0.13 (2007-02-24)
            apc_clear_cache();
        } elseif ( extension_loaded( 'eaccelerator' ) ) {
            @ini_set( 'eaccelerator.optimizer', 0 );
            if ( function_exists( 'eaccelerator_optimizer' ) ) {
                @eaccelerator_optimizer( false );
            }
            // Try setting eaccelerator.optimizer = 0 in a .user.ini or .htaccess file
        } elseif (extension_loaded( 'Zend Optimizer+' ) ) {
            @ini_set('zend_optimizerplus.optimization_level', 0);
        }
    }

    /**
     * Start profiling
     * @access public
     * @return void
     */
    public static function start_profile() {
        if (0 === self::$_last_time) {
            self::$_last_time = microtime(true);
            self::disable_opcode_cache();
        }
        register_tick_function(array(__CLASS__, 'do_profile'));
    }

    /**
     * Stop profiling
     * @access public
     * @return void
     */
    public static function stop_profile() {
        unregister_tick_function(array(__CLASS__, 'do_profile'));
    }

    /**
     * Profile.
     * This records the source class / function / file of the current tickable event
     * and the time between now and the last tickable event. This information is
     * stored in self::$_profile
     * @access public
     * @return void
     */
    public static function do_profile() {

        // Get the backtrace, keep the object in case we need to reflect
        // upon it to find the original source file
        if ( version_compare( PHP_VERSION, '5.3.6' ) < 0 ) {
            $bt = debug_backtrace( true );
        } elseif ( version_compare( PHP_VERSION, '5.4.0' ) < 0 ) {
            $bt = debug_backtrace( DEBUG_BACKTRACE_IGNORE_ARGS | DEBUG_BACKTRACE_PROVIDE_OBJECT );
        } else {
            // Examine the last 2 frames
            $bt = debug_backtrace( DEBUG_BACKTRACE_IGNORE_ARGS | DEBUG_BACKTRACE_PROVIDE_OBJECT, 2 );
        }

        // Find the calling function $frame = $bt[0];
        if ( count( $bt ) >= 2 ) {
            $frame = $bt[1];
        }

        // If the calling function was a lambda, the original file is stored here.
        // Copy this elsewhere before unsetting the backtrace
        $lambda_file = @$bt[0]['file'];

        // Free up memory
        unset( $bt );

        // Include/require
        if ( in_array( strtolower( $frame['function'] ), array( 'include', 'require', 'include_once', 'require_once' ) ) ) {
            $file = $frame['args'][0];

        // Object instances
        } elseif ( isset( $frame['object'] ) && method_exists( $frame['object'], $frame['function'] ) ) {
            try {
                $reflector = new ReflectionMethod( $frame['object'], $frame['function'] );
                $file = $reflector->getFileName();
            } catch ( Exception $e ) {
            }

        // Static method calls
        } elseif ( isset( $frame['class'] ) && method_exists( $frame['class'], $frame['function'] ) ) {
            try {
                $reflector = new ReflectionMethod( $frame['class'], $frame['function'] );
                $file = $reflector->getFileName();
            } catch ( Exception $e ) {
            }

        // Functions
        } elseif ( !empty( $frame['function'] ) && function_exists( $frame['function'] ) ) {
            try {
                $reflector = new ReflectionFunction( $frame['function'] );
                $file = $reflector->getFileName();
            } catch ( Exception $e ) {
            }

        // Lambdas / closures
        } elseif ( '__lambda_func' == $frame['function'] || '{closure}' == $frame['function'] ) {
            $file = preg_replace( '/\(\d+\)\s+:\s+runtime-created function/', '', $lambda_file );

        // File info only
        } elseif ( isset( $frame['file'] ) ) {
            $file = $frame['file'];

        // If we get here, we have no idea where the call came from.
        // Assume it originated in the script the user requested.
        } else {
            $file = $_SERVER['SCRIPT_FILENAME'];
        }

        // Function
        $function = $frame['function'];
        if (isset($frame['object'])) {
            $function = get_class($frame['object']) . '::' . $function;
        }

        // Create the entry for the file
        if (!isset(self::$_profile[$file])) {
            self::$_profile[$file] = array();
        }

        // Create the entry for the function
        if (!isset(self::$_profile[$file][$function])) {
            self::$_profile[$file][$function] = 0;
        }

        // Record the call
        self::$_profile[$file][$function] += (microtime(true) - self::$_last_time);
        self::$_last_time = microtime(true);
    }
}
Known Issues
This approach does have some limitations and we’ve learned every single one of them through trial and error. The following are things that will bite you!
- You can only profile using tickable events. The PHP manual defines a tick as:
An event that occurs for every N low-level tickable statements executed by the parser… Not all statements are tickable. Typically, condition expressions and argument expressions are not tickable.
- This means some code won’t generate a callback to your tick function. For example, PHP internal function calls are not tickable. Functions that only return a value and do not perform any other operations will not generate any tick events. For example:
declare(ticks=1);
register_tick_function('do_profile');

$profile = array();
$last_time = microtime(true);

func_one();
show_profile();

function do_profile() { ... }

function show_profile() { ... }

function func_one() {
    usleep(10 * 1000);
    func_two();
}

function func_two() {
    return true;
}
This profile will not show any calls to “func_two” in the output.
- Extensions that cache / optimize opcode can impact your results. After much trial and error and testing, here’s what we found (Your mileage may vary, so feedback is welcome.):
- eaccelerator – The optimizer impacted results, but the cache did not.
Workaround 1 – Disable the optimizer by setting eaccelerator.optimizer = 0 in .user.ini or .htaccess
Workaround 2 – Put your app in eaccelerator’s allowed admin path and calleaccelerator_optimizer(false);. - Xcache – The FAQ states that an optimizer is coming in version 2. In our testing, we found that the number of tickable events was reduced with Xcache 1.3.x installed, compared to no opcode cache / optimizer extension. There is no workaround available.
- Zend Optimizer+ – This impacted our results.
Workaround – Set zend_optimizerplus.optimization_level = 0 in .user.ini or .htaccess. This value can also be changed viaini_set(). - APC – There is no optimizer as of 3.0.13. The opcode cache impacted results.
Workaround – Callapc_clear_cache()before you start profiling. This will empty your entire opcode cache every time you start profiling. Be judicious!Note: Opcode cache and optimizers are generally safe and good for performance. This section offers advice on how to disable opcode caches and optimizers for a special use case. Proceed with caution. - The tick function (called do_profile above) will be called for every tickable event. For a large application, this means your profiler function can be called thousands of times. Every optimization counts here. If you’re writing targeted profiling code (i.e., “Look for this certain element in the backtrace.”), you will want to invest some time in optimizing it. I will admit that I’ve used xdebug to find performance issues in early versions of P3.

- Other php code can interfere with your code. If an engineer re-declares the tick directive, there’s nothing you can do about it.
// This will disable profiling via register_tick_function
declare (ticks=0);
- If a piece of code unregisters your tick function, then you’re equally out of luck.
- There is a warning that
register_tick_function()is not compatible with multi-threaded Web servers and PHP versions older than 5.3. See the documentation on php.net for more details.
- eaccelerator – The optimizer impacted results, but the cache did not.
Conclusion
I am constantly surprised by the amazing things that can be accomplished with PHP. When we first set out to make P3, I wasn’t sure how we were going to do it. This was a fascinating problem to solve. We couldn’t have done this without the feedback we’ve received from the WordPress community. I hope to post more about the development of P3 in the future.