I wrote earlier about how to use register_tick_function to profile your code. I’ve expanded the article and included a working profiler class on inside.godaddy.com in my latest post on Write Your Own Code Profiler.
Monthly Archives: April 2012
Apache Traffic Server as a Reverse Proxy
Varnish is a great tool to have if you need a scriptable proxy server. For most sites, though, this will be more complex than necessary. Check out this article on how to speed up WordPress with Varnish.
I propose that most users don’t need the power of VCL, though. They’d be much better off with a high performance proxy server with RFC 2616 compliance and simple configuration.
Allow me to play devil’s advocate and show you how to build and configure Apache Traffic Server, then show you benchmark results:
# built on centos 6.2
# Get traffic server pre-requisites
yum install gcc-c++ openssl-devel tcl-devel expat-devel pcre-devel make

# Get traffic server
wget http://apache.tradebit.com/pub/trafficserver/trafficserver-3.1.3-unstable.tar.bz2
tar -xf trafficserver-3.1.3-unstable.tar.bz2
cd trafficserver-3.1.3-unstable

# Build traffic server
./configure
make -j 8

# Install traffic server
make install
ln -s /usr/local/bin/trafficserver /etc/init.d/trafficserver
chkconfig --add trafficserver
chkconfig trafficserver on

# Configure traffic server URL map
echo "map http://YOURDOMAIN.COM http://localhost" >> /usr/local/etc/trafficserver/remap.config
echo "reverse_map http://localhost http://YOURDOMAIN.COM" >> /usr/local/etc/trafficserver/remap.config

# Run traffic server
trafficserver restart
Note: Traffic Server runs on port 8080. I used my host’s router to map port 80 -> 8080 and left httpd on port 80.
Since traffic server is now handling all incoming requests, the web server logs will be unreliable. You can rely on an in-browser analytics package, or see how to configure Traffic Server for combined logs.
Configuration done
Let’s benchmark.
Note: my test site is using W3 Total Cache. W3TC sets the cache-control, last-modified, and expires headers on the pages, and static content so that traffic server knows how to best cache your content. You can also use the Varnish integration in W3TC with traffic server. This will purge pages from the traffic server proxy whenever you purge them from W3TC.
Protip: If you need to have Traffic Server work without an expires header or cache-control header, look in records.config and find this section:
# required headers: three options:
#   0 - No required headers to make document cachable
#   1 - "Last-Modified:", "Expires:", or "Cache-Control: max-age" required
#   2 - explicit lifetime required, "Expires:" or "Cache-Control: max-age"
CONFIG proxy.config.http.cache.required_headers INT 2
Look at blitz.io. I used this command in the blitzbar:
# If you paid for blitz, you can max out at 1,000 concurrent users
# -p 1-1000:5,1000-1000:55 -r california -H 'Accept-encoding: gzip' http://YOURDOMAIN.COM/
-p 1-250:1,250-250:59 -r california -H 'Accept-encoding: gzip' http://YOURDOMAIN.COM/
For these benchmarks, I paid to upgrade blitz.io to allow 1,000 concurrent users. At 250 concurrent users, the performance profiles of these systems didn’t really shine through.
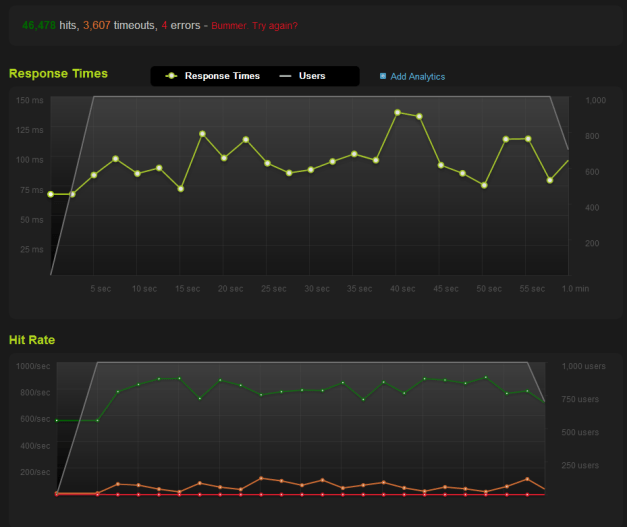
Here’s the Varnish benchmark.
Here’s the Traffic Server benchmark:
For comparison, here’s Apache HTTPD alone:
Notice how Varnish doesn’t like the initial influx of connections. Notice how Varnish had more timeouts, too. Notice, too, how much of a difference these caching systems make. Remember, the Apache HTTPD benchmark is already using WordPress + W3 Total Cache.
Let’s look at apachebench for a different view. Using this command, I benchmarked raw Apache HTTPD vs. Varnish vs. Traffic Server. This is all done locally over a loopback connection.
# Change the port to 80 to benchmark apache directly
ab -c 250 -n 1000000 -k -H "Host: YOURDOMAIN.COM" http://127.0.0.1:8080/
Apache results (no chance!):
apr_socket_recv: Connection timed out (110)
Total of 17725 requests completed
Varnish results:
Time taken for tests:   95.049 seconds
Complete requests:      1000000
Failed requests:        0
Requests per second:    10520.83 [#/sec] (mean)
Time per request:       23.762 [ms] (mean)
Time per request:       0.095 [ms] (mean, across all concurrent requests)
Transfer rate:          75257.95 [Kbytes/sec] received
Traffic Server results:
Time taken for tests:   50.971 seconds
Complete requests:      1000000
Failed requests:        0
Requests per second:    19619.00 [#/sec] (mean)
Time per request:       12.743 [ms] (mean)
Time per request:       0.051 [ms] (mean, across all concurrent requests)
Transfer rate:          139371.67 [Kbytes/sec] received
Conclusion
According to blitz.io, Varnish and Traffic Server benchmark results are close. According to ab, Traffic Server is twice as fast as Varnish. Configuration is different in each package. Traffic Server has some unique features like the ability to act as as a forward proxy and a reverse proxy, the ability to proxy SSL connections, a plugin architecture, and will soon have SPDY support. If you haven’t heard of Traffic Server yet, you should check it out. If you’re not using a caching proxy, please start using one!
For more information on Apache Traffic Server, check out this 2011 USENIX presentation (PDF, 10.4 MB) by Leif Hedstrom
Apache combined log format with Traffic Server
If you’re using apache traffic server, all of your traffic is going through your proxy, not your web server. This is a problem if you rely on your logs for visitor data.
You can get traffic server to output logs in apache’s combined log format, though. Then you just feed traffic server’s logs to your log analysis app.
Here’s how to do it:
Edit /usr/local/etc/trafficserver/logs_xml.config
Add these lines to the bottom:
<LogFormat>
    <Format = "%<chi> - - [%<cqtn>] \"%<cqhm> %<cquup>\" %<pssc> %<psql> \"%<{Referer}cqh>\" \"%<{User-Agent}cqh>\"" />
    <Name = "httpd_combined"/>
</LogFormat>
<LogObject>
    <Format = "httpd_combined"/>
    <Filename = "access"/>
</LogObject>
Edit /usr/local/etc/trafficserver/logs_records.config
Change
CONFIG proxy.config.log.custom_logs_enabled INT 0
to
CONFIG proxy.config.log.custom_logs_enabled INT 1
Then restart traffic server
trafficserver restart
Now you’ll have an apache combined log file in /usr/local/var/log/trafficserver/access.log
You can read more about apache traffic server’s logging options here and the log formats here.


